
As an academic researcher, one of the most interesting spaces design has been valuable for me is in creating diagrams to help explain concepts in my work. Diagrams can tell the story or idea in ways that are more accessible or compelling than plain text or tables, and I find that when trying to synthesize major concepts I’ve been exploring, designing diagrams not only helps create a new artefact for my work, but also helps me organize my thoughts by activating my “designer brain” to see the concepts a different way.
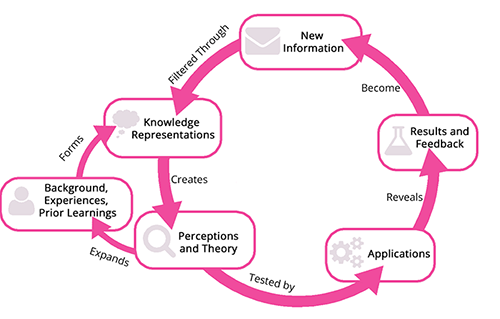
One of my first diagrams illustrates how mental models are continuously being leveraged and adapting based on our environments. We engage in cycles of accessing our models, using them to draw conclusions, and refining or confirming those models based on the observed behaviors. I wanted to use a cyclic design to represent this as an ongoing process of actions and reactions.
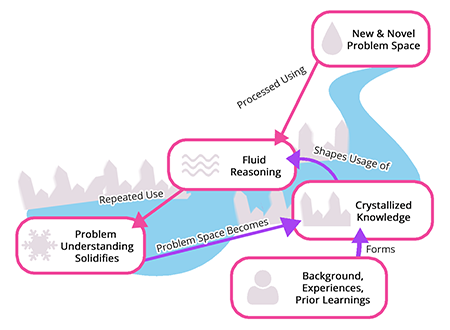
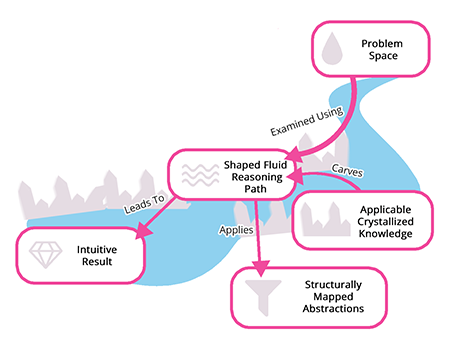
I also used this same diagram layout to propose how what we coin as intuition in novel problem spaces may work cognitively given the above process. It takes the same general components and idea, and proposes that through specific fluid reasoning paths being repeatedly used, we naturally gravitate to specific conclusions in certain contexts, and near instinctively arrive at intuitive assumptions or answers through them. This diagram simply illustrates a potential idea for what intuition means cognitively, but I felt that in designing it in parallel to the prior diagram, it showcased why this concept may be viable given the previous diagram’s discussion.

I also wanted to illustrate relationships between fluid and crystallized intelligence and mental models, and how knowledge can transform from fluid to crystallized. This diagram’s design was inspired by the idea of water systems in caverns forming stalactites and stalagmites – the fluid elements transform to crystalized, solid elements through time and wear.
A core aspect of my theoretical framework was Dedre Gentner’s work on structure mapping and career of metaphor, and I used diagrams to explain aspects of her work as well in order to ensure the theories I was drawing most from were understood.
I explained our abstracted schema as filters through which we compared and understood information, and showed the process of schema abstraction by using tiny “bug creatures” for the process of analogical reasoning. We compare two items to find the commonalities – in this case, two concrete bugs are compared and a fairly rigid understanding of “what a bug looks like” is abstracted out – bugs have a rounded body, three eyes of varying circular shapes, and three legs at the bottom.

After the abstraction process, new bug information was added – this bug is different. The body is not circular, and it now has four eyes and four legs. In attempting to reason about this with regard to the previous schema, the model must be modified of “what a bug looks like” – this results in further abstraction. The body shape is now amorphous, as it is does not have to be a circle. The eyes and legs also share a new relationship – it is not specifically three, but rather, that the number of eyes and number of legs (“n”) will be the same. The abstraction that was created in mind for “what a bug looks like” is revised in our work to classify the new information as a bug. This abstracted schema for “bugs” is a filter we use to explore the world, built on mapping structures and relationships between entities and ideas.
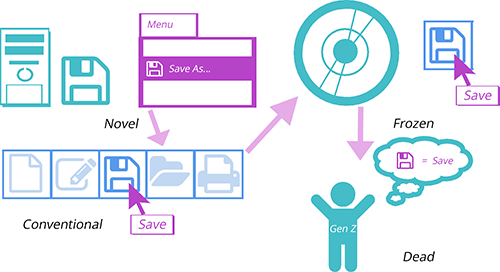
The bug diagram complimented the mental model usage and revision diagram by showcasing how analogical reasoning theories play a role in this process. My second diagram explained career of metaphor using the concept of a floppy disk, and how its image has come to mean “save” as a dead metaphor, where originally the floppy disk image was used to draw the analogically reasoned conclusion of “what saving does” – saves to the item inserted in the computer that looks like this. This image allowed me to illustrate the career process, showcase an example of it within the computing domain, and then lead into discussion of how the metaphorical nature of concepts in a digital environment is shaped by the concept of career of metaphor.
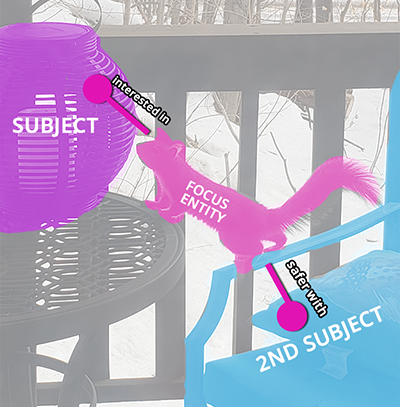
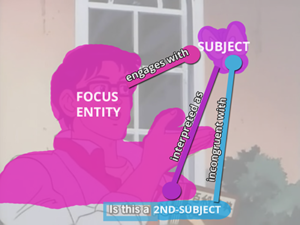
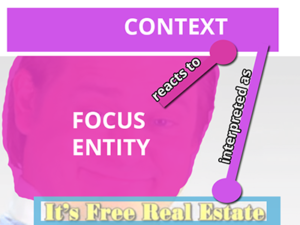
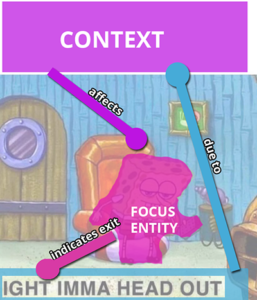
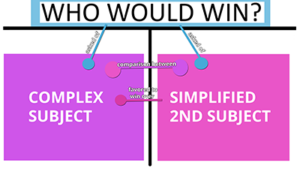
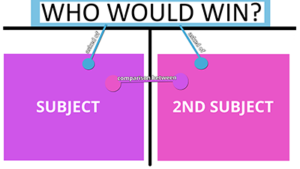
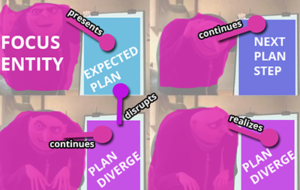
I also developed entity-relationship diagrams (based in structure mapping) to explain the analogical relationships found in memes. One of the studies I conducted for my research explored how students reason about memes and come to understand programming memes and “what they mean”.
These diagrams show the clearly analogical nature of the meme templates used in the study by highlighting the entities and drawing the direction of their relationships. Ideas reflecting the relationships here became a dead metaphoric schema for many participants, allowing them to instantly reason about “what the meme meant” through a near intuitive understanding of these mappings.
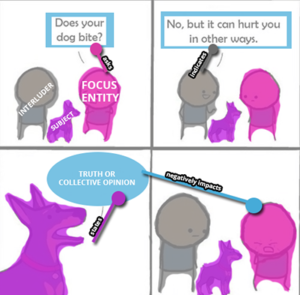
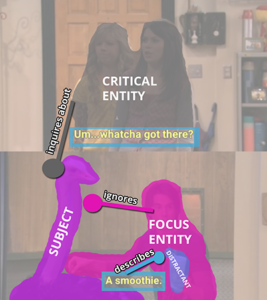
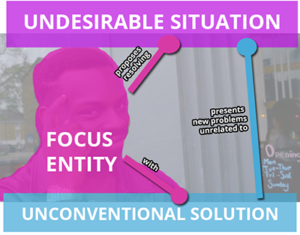
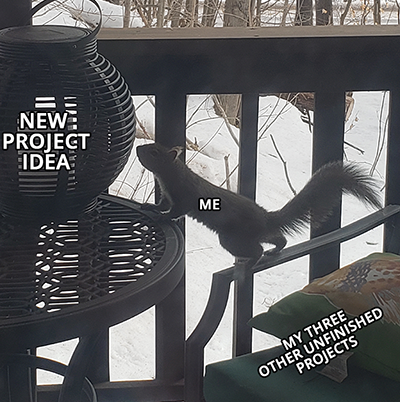
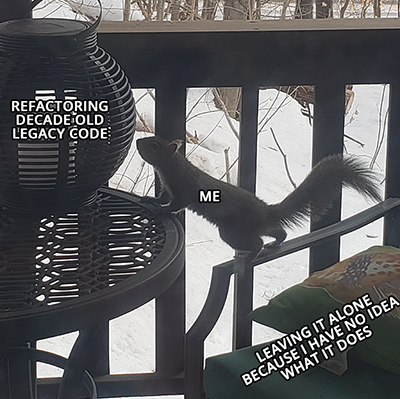
In the interest of showcasing how these templates were drawn on the memes, I also created diagrams of a “fake meme” I created for illustrative purposes. I show examples like the participants in the study were given – they saw the meme templates, a nonprogramming example, and a programming one. I used a photo I had taken of a curious squirrel in my yard to create two fake memes fitting the same themes participants saw, and then drew the entity relationships of “using the meme correctly” on the image to showcase the mapping process in making memes. This allowed those who may be unfamiliar with memes to see examples using an image I owned and a memetic mapping I had created to see how these entities and relationships map in actual usage, and how an image from a show or real life can come to take on memetic meaning.